

How to Measure Share of Voice in AI-Generated Answers
AI share of voice measures whether a language model mentions, cites, or recommends a brand when answering a real question, and how that showing stacks up against competitors. This piece breaks down how to build that measurement from scratch: the prompts, the tracking, the math, and the decisions that should come out the other end. Most teams get the starting point wrong, and that mistake costs them the whole exercise. More on that below.
Search behavior has shifted. A growing share of research that used to run through Google now runs through ChatGPT, Claude, Gemini, and Perplexity, especially for B2B buyers comparing vendors or working through a technical decision. Visitors who arrive from AI assistants also tend to convert at a higher rate than visitors from organic search. The traffic is smaller in raw volume for most sites, but it shows up later in the decision, which makes each visit worth more. Google's own AI Overviews now show up on most searches, and click-through on those results pages has dropped hard. Attention is moving upstream, into the answer itself, before a user ever sees a blue link.
That shift changes what "invisible" means for a brand. Missing from an AI-generated answer is starting to look like falling off page one of Google, except there's no Search Console equivalent to flag it. Nobody gets an email saying "your citation rate dropped 12 points this month." Generative referral traffic has grown faster year over year than almost any other channel, and the brands tracking their standing in these answers systematically are pulling ahead of the ones who just type their own name into ChatGPT and eyeball the result.
What AI share of voice actually measures and how to define it precisely
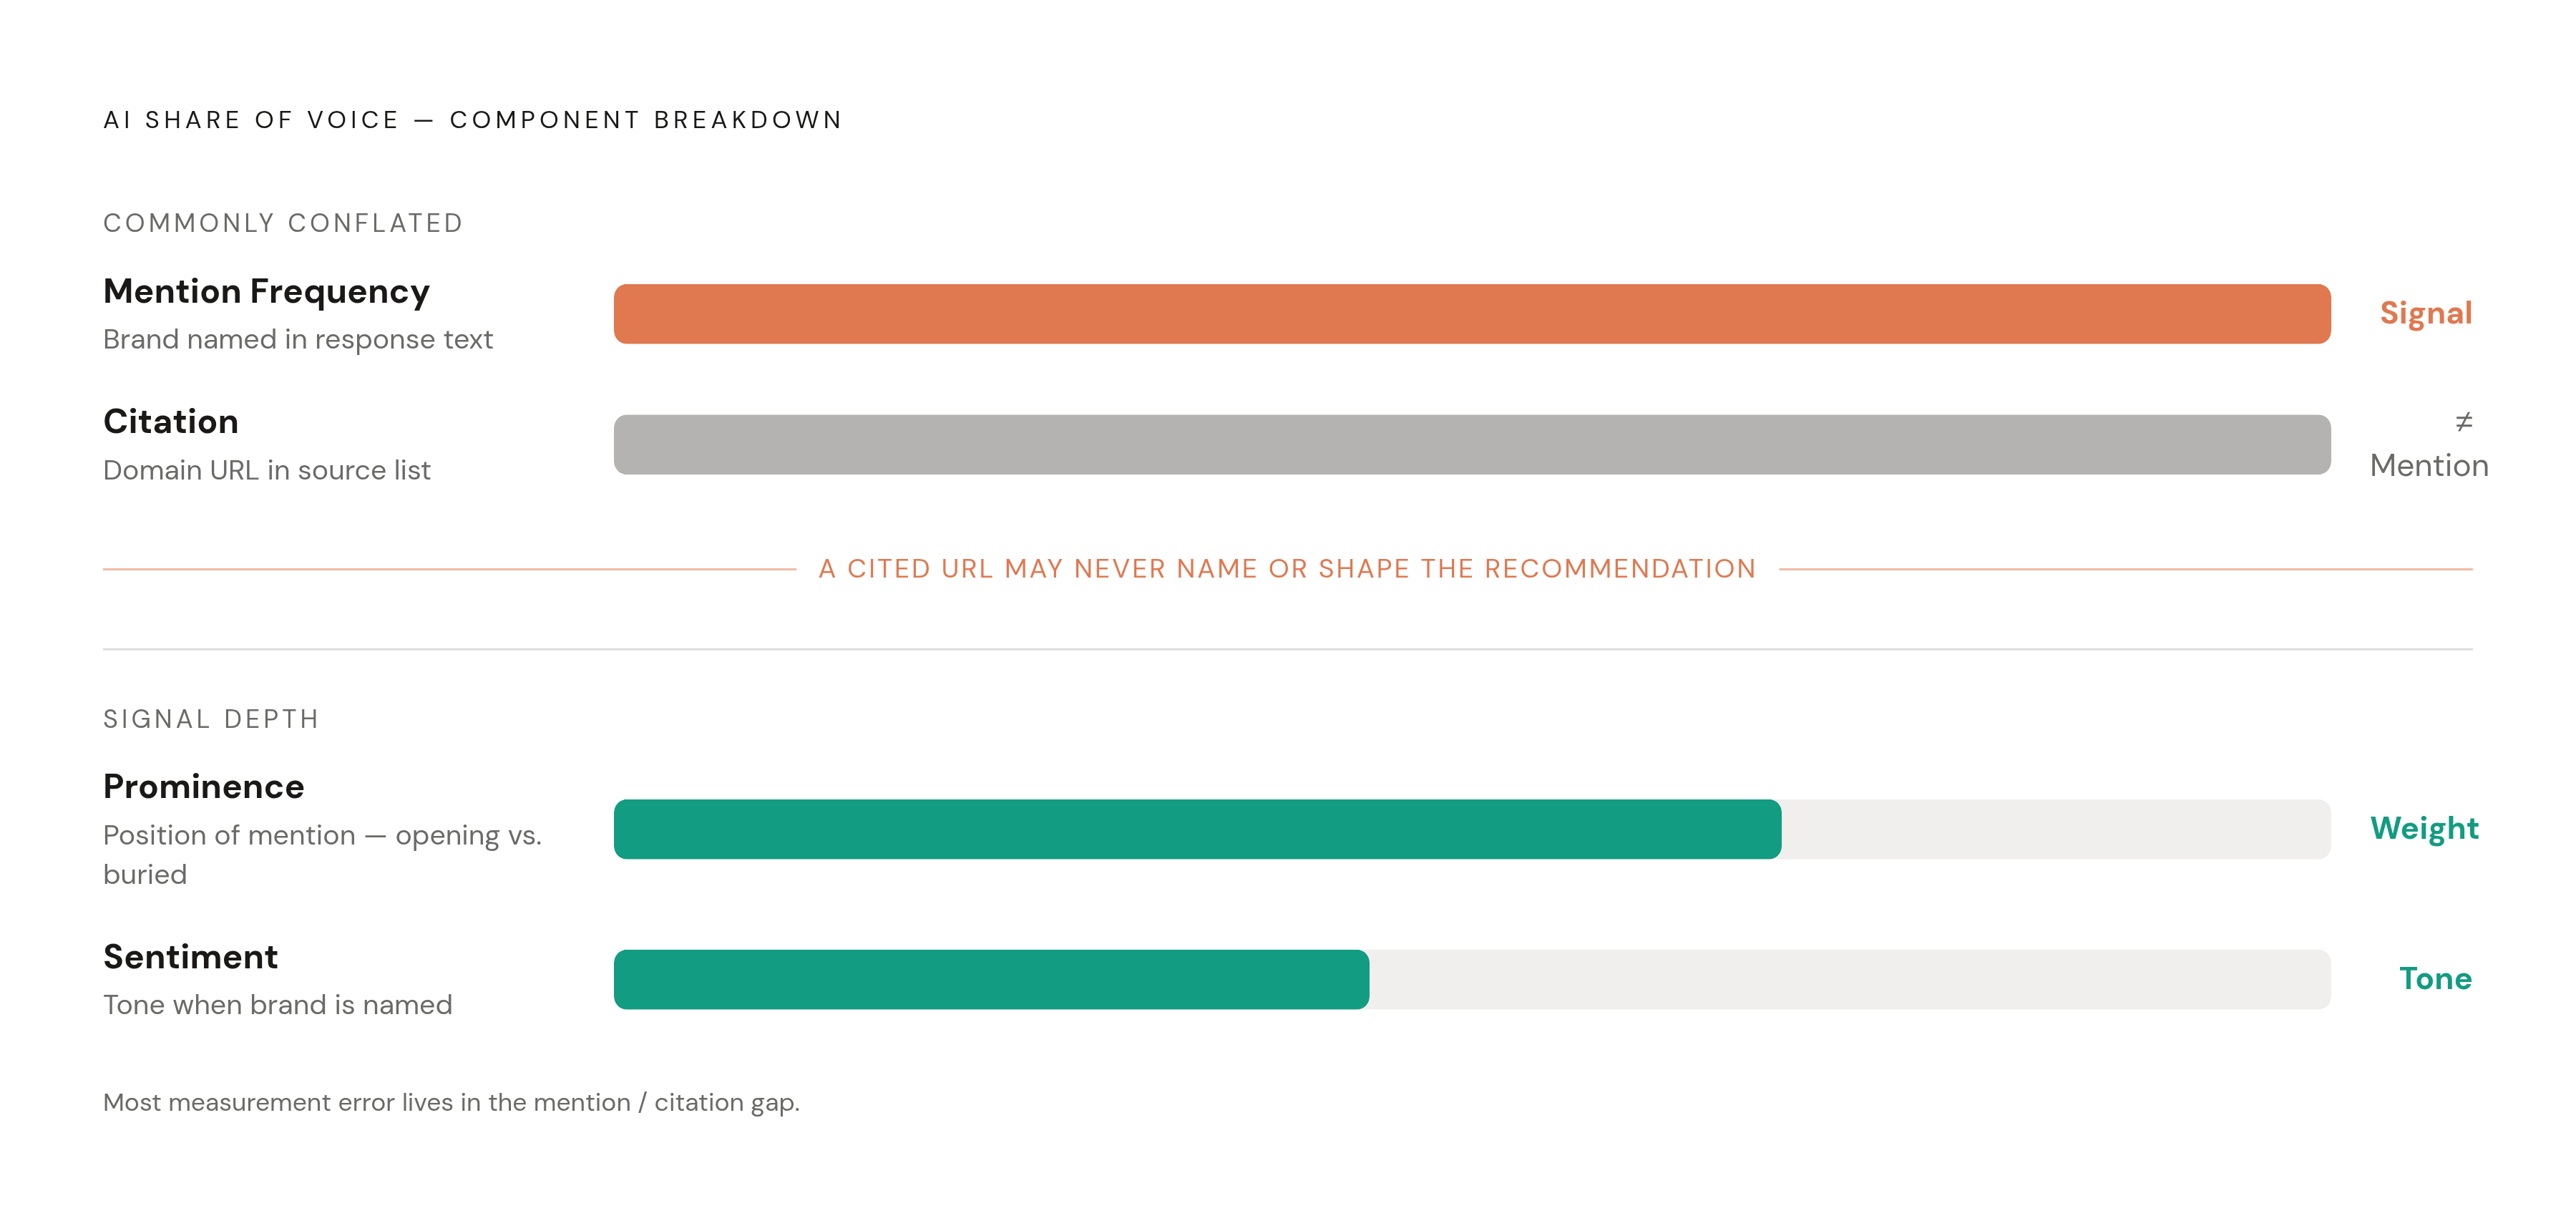
Take a set of prompts. Run them across models. AI SOV is the share of resulting responses that mention, cite, or recommend a given brand, out of the total brand mentions across every response in that set.
The formula, stripped down: your brand's mentions divided by total brand mentions across all tracked responses, times 100. That's the percentage.
It captures two separate things at once. First, whether a brand shows up at all, which is a basic visibility question. Second, whether it shows up more than the brands it competes with, which is the competitive question. A brand can score well on the first and still lose on the second if three competitors get named twice as often.
Four things feed into the number, and they're not interchangeable:
- Mention frequency: does the brand name appear in the response text?
- Citation: is a URL from the brand's domain listed as a source?
- Prominence: where does the mention land, opening line or buried in a footnote?
- Sentiment: how does the model talk about the brand when it names it?
Here's the mistake almost everyone makes: treating mention and citation as the same thing. A brand's URL can sit in a source list at the bottom of an answer without the response text ever naming the brand or shaping the recommendation. Track them separately, or the number hides more than it shows.
None of this means anything without two fixed anchors: a defined competitor set and a defined prompt set. "Our AI SOV is [some figure]" isn't a sentence with any content in it until someone says 22% of what, against whom. Across most industries, brand mention rates in AI answers sit low on average, with a small group of category leaders pulling way ahead of the pack. That gap is the opportunity, and it's a wide one.
How AI SOV differs from traditional share of voice and why those differences change the measurement approach
Traditional SOV counts what got said about a brand in the press, on air, across social channels. AI SOV counts something stranger: whether a model, building an answer from scratch, decides your brand belongs in it. That's a retrieval and reasoning process, not a media tally, and treating it like one is where most measurement plans go wrong from the start.
Ranking well on Google doesn't buy much here. Research looking at large sets of AI prompts has found the overlap between what AI models cite and what ranks on page one organically is small, well under a fifth of citations in most cases, and lower still on ChatGPT specifically. A page one ranking and an AI citation answer two different questions for two different systems. Anyone still treating an SEO win as an AI visibility win is measuring the wrong thing.
Platforms don't even weigh a "mention" the same way. Perplexity tends to cite more sources per answer, but each one carries less individual pull on the final response. ChatGPT cites fewer sources, and each one tends to matter more. So a citation on one platform and a citation on another aren't the same unit of currency, even though the tracking spreadsheet might record them identically.
The source pool is also wider than anything Google's index ever pulled from for a ranking. Forums, review sites, Reddit threads, community Slack exports that got indexed somewhere, all of it feeds into how a model represents a brand. AI SOV ends up reflecting a brand's footprint across the entire web, not just what's published on its own domain. And there's no dashboard for any of it yet. Every bit of this gets built by hand, at least for now.
How each major AI platform decides which brands to surface
Four models, four different systems, one shared instinct: they all favor brands that show up consistently across multiple independent sources, not just a brand's own marketing copy.
ChatGPT, Claude, Gemini, and Perplexity each blend training data with live retrieval, pulling from Bing, Google, and Brave respectively, filtered through safety layers that shape what gets surfaced. The sourcing habits diverge sharply underneath that shared structure.
Gemini pulls from the Google ecosystem directly, including Shopping Graph data and Google's own search index, giving it the widest surface area of the four for picking up brand signals. Schema markup measurably improves citation odds in Gemini's answers, more than on the other three platforms.
ChatGPT leans on Wikipedia and third-party review sites as go-to citation sources. A brand with a strong, credible presence on third-party review platforms has a real structural edge there.
Claude tends toward earned editorial coverage: real journalism, from outlets with a track record. A brand that's landed profiles or coverage in trade press or major outlets has an advantage baked into how Claude weighs sources.
Here's the part that gets overlooked constantly: Gemini renders JavaScript. Claude and Perplexity largely don't; they read static HTML. A brand running a JavaScript-heavy site with content that only loads client-side can end up functionally invisible to two of the four major models, no matter how good that content actually is.
And the source concentration is stark. A small number of domains account for a disproportionate share of citation volume across these models, more concentrated than anything traditional search rankings ever produced. That means the ecosystem a brand shows up in, not just the brand's own site, carries real weight. The practical takeaway for measurement: track SOV per platform, never blended into one number. A brand can climb on Gemini and slide on Claude in the same month, for reasons specific to each platform's sourcing habits.
Building the prompt set that the entire measurement depends on
Here's the mistake, by a wide margin: building a prompt set out of branded queries. "Tell me about [Brand]." Those prompts prove almost nothing, because a model asked directly about a brand will usually say something about it. Real AI visibility lives at the category level, where a brand earns its way into an answer nobody asked for by name. Anyone skipping straight to branded prompts is measuring flattery, not visibility.
A working prompt set needs four categories covered:
- Product comparison prompts, pitting the brand's category against named competitors
- Problem-solution prompts, connecting a pain point to a class of solution
- Industry expertise prompts, testing thought leadership and category authority
- Feature-specific prompts, covering capabilities and specific use cases
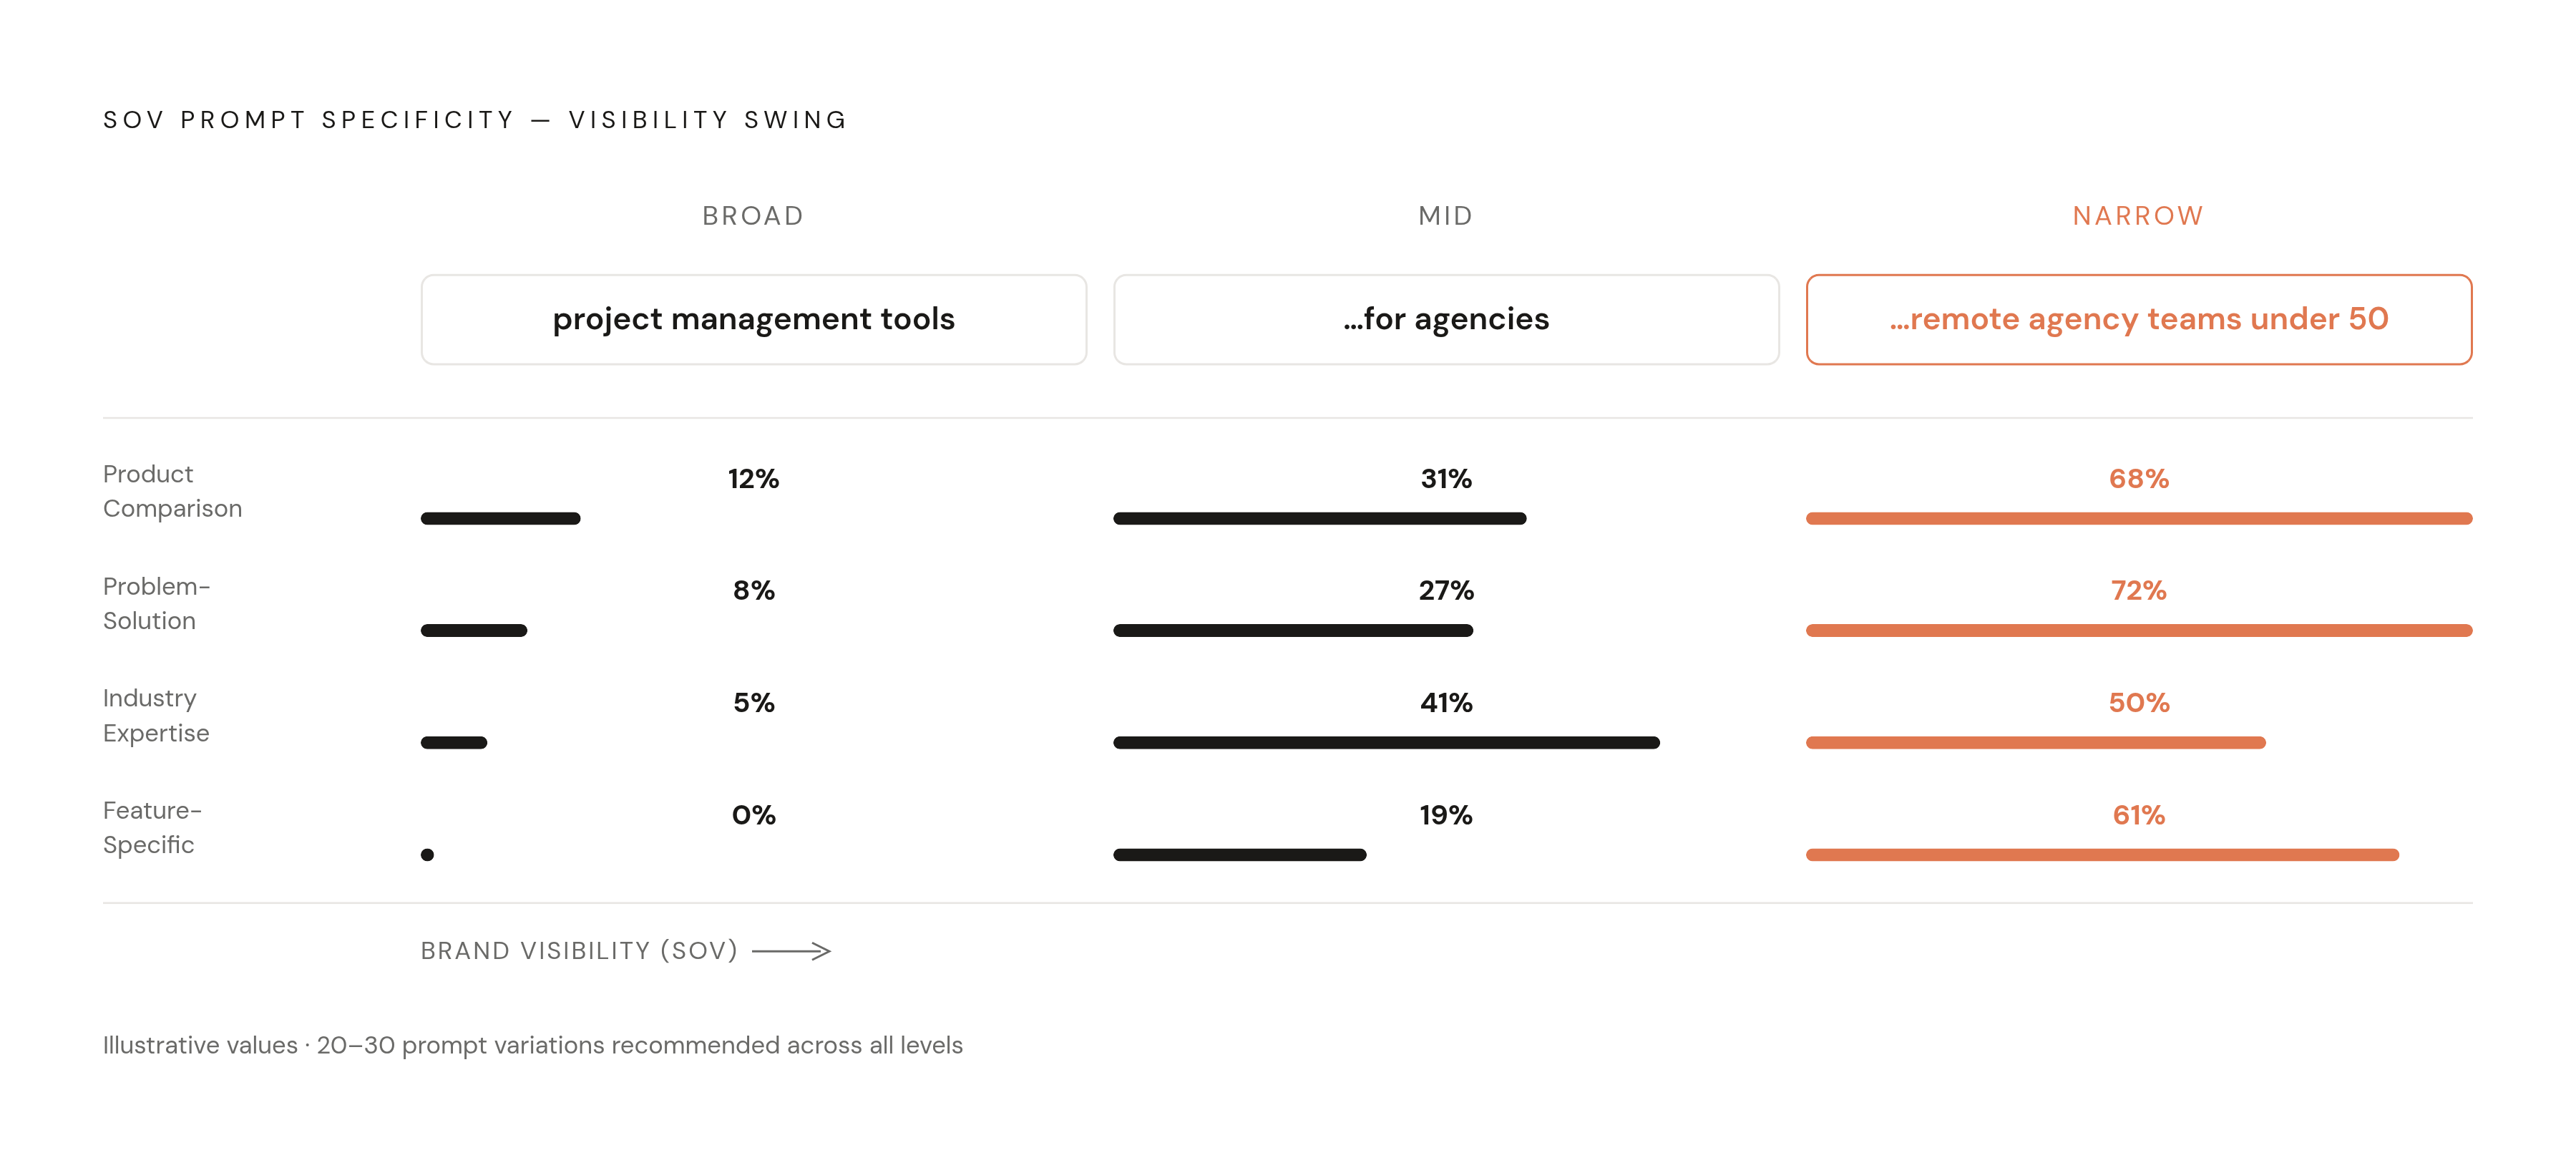
Within each category, build a specificity ladder. Start broad ("project management tools"), move to mid-level ("project management tools for agencies"), then get narrow ("project management tools for remote agency teams under fifty people"). Visibility often swings hard as specificity increases; a brand invisible at the broad level sometimes dominates the narrow one, or the reverse.
Twenty to thirty prompt variations is a reasonable target for a working library, spanning early awareness questions through late-stage decision prompts. Teams just starting out can run ten to twenty and expand as capacity allows. There's no rule that says the full set has to exist on day one.
The prompts worth the most attention are the ones where a brand should logically appear but isn't named in the question at all. Those test real, unprompted visibility, rather than just confirming what a user already typed.
Write down the reasoning behind each prompt: what competitor question it stands in for, what funnel stage it maps to. Skip this step and six months of tracking data turns into a spreadsheet nobody can read.
Running queries consistently across models and recording results in a format that yields a trend
Four platforms, tracked as four separate columns. ChatGPT, Claude, Gemini, Perplexity. Never average them into one number; their citation behavior diverges enough that averaging erases the exact signal worth watching.
Cadence matters more than most teams assume going in. Weekly or biweekly for anyone in a competitive category. Monthly is the floor for a brand that wants trend data instead of a single snapshot that might just be noise.
AI responses shift between sessions, driven by model temperature settings, retrieval index updates, and context window differences that have nothing to do with a brand's actual standing. Run each prompt multiple times in a session and record the modal result, the answer that showed up most often, instead of trusting a single run.
At minimum, a tracking sheet needs these fields: query text, platform, date, whether the brand was mentioned, position of the mention (opening, middle, closing), which competitors got named, which sources got cited, and a sentiment rating.
Manual tracking works fine for a small prompt set, maybe up to a few dozen variations run by hand. Past that, into the hundreds, querying by hand stops being realistic, and API-based automation becomes the only workable option. API-based tooling can handle this end of things: dispatching prompts, querying across models, and pulling results together so a team isn't building that infrastructure from zero.
One more corroborating data point worth setting up: GA4 referral traffic from AI domains, chat.openai.com, claude.ai, gemini.google.com, perplexity.ai. A custom channel grouping tracking that traffic as its own line gives a second, independent signal running alongside the manual prompt tracking.
Calculating AI SOV from raw mention data, and weighting it for prominence and sentiment
Start simple. For each prompt run, count every brand mention across every response, then divide the brand's own mentions by that total. That's raw mention-based SOV. It's reproducible and comparable over time, which makes it a fine starting point, but it stops there for a reason.
Raw frequency alone misses something obvious: a brand named once, in passing, at the tail end of a response, isn't doing the same work as a brand introduced as the top recommendation in the opening sentence.
Prominence weighting fixes that. A simple three-tier system works well enough: primary recommendation, secondary mention, incidental reference. Weight each tier differently, and the resulting number reflects actual influence rather than just word count.
Sentiment needs its own separate track entirely. A cautionary or negative mention isn't neutral; it actively hurts. A brand showing up in an answer with a warning attached might be worse off than not showing up at all. Score each mention positive, neutral, or negative, and keep that score distinct from the prominence score rather than folding it in.
Combine the two, weighting each mention by both its prominence tier and its sentiment, before dividing into the total. That produces a quality-adjusted SOV, one that reflects how well a model actually represents a brand rather than just how often the name gets typed out.
Keep the raw components visible even after building the combined score. Raw frequency, prominence score, sentiment distribution, tracked separately. A drop in the combined number could mean fewer mentions, worse placement, more negative framing, or some mix of all three, and there's no way to tell which without the components broken out. Keep platform scores separate too; blending them into one cross-platform figure hides exactly the kind of platform-specific move that needs a platform-specific response.
Benchmarking your SOV against competitors to make the number strategically meaningful
Run the identical prompt set, on the identical cadence, scored with the identical method, against two to four direct competitors. Consistency of method is the entire point. Change any variable between a brand's tracking and a competitor's, and the comparison stops meaning anything.
Build a competitive snapshot: for each platform and each prompt category, list every tracked brand's share side by side. The shares should roughly sum to the total named mentions in that set, with some leftover going to brands outside the tracked group.
The absolute number matters less than its direction. Is a brand's share growing or shrinking against a specific competitor, on a specific platform, in a specific prompt category? That's the question worth answering every cycle, not "what's our score this week."
Break the data down by category. A brand might lead comfortably on problem-solution prompts while trailing badly on comparison prompts. That split points directly at where content investment needs to go next.
Share of voice in traditional media has tended to lead market share over time, not follow it. The same logic likely holds here. Brands building mention share today in these answers are probably building tomorrow's consideration pipeline, even if the near-term traffic numbers don't look dramatic yet.
Watch for anomalies too. If a competitor suddenly starts appearing in prompts where they were absent a month ago, something changed: new PR, a content push, a review site campaign. That's worth investigating, not just logging.
Interpreting trend data and deciding which changes in AI SOV are worth acting on
A single week of data proves almost nothing. Model variance runs high session to session, so one week's dip or spike could just be noise. Look for a direction that holds consistently over multiple cycles before drawing any conclusion or changing a content plan based on it.
Three kinds of signal are worth real attention. A sustained drop in mention frequency on one prompt category suggests the content backing that category has lost authority somehow. A shift from positive sentiment toward neutral or cautionary framing suggests something in the broader information ecosystem, reviews, forum threads, press, is changing how models talk about the brand. A competitor gaining share on prompts where a brand used to lead is a direct competitive signal, full stop.
Cross-check SOV movement against the GA4 AI referral data. If SOV drops and referral traffic drops in the same window, that's a stronger, confirmed signal. If SOV drops but traffic holds steady, the issue is more likely about how the brand gets represented than about raw visibility volume.
Recency plays a bigger role than most people expect. Models tend to favor recently published content over older material covering the same ground. A SOV decline tied to aging content is often a publishing cadence problem, not a strategic failure; the fix might just be refreshing what's already there.
Sentiment often moves before frequency does. Treat sentiment as an early warning system, worth checking on its own regularly, instead of waiting for it to show up as a drop in the raw mention count later.
Set actual thresholds instead of eyeballing every data point by hand: a defined drop in weekly SOV, or any appearance of negative sentiment on a core prompt, should trigger a review automatically. Lettertrace surfaces these shifts on its own, which beats diffing spreadsheets manually every Monday morning.
What actions the SOV data should drive in content and distribution strategy
None of this measurement is worth building if it doesn't change what gets published, and where. A number sitting in a dashboard, admired quarterly, isn't doing its job.
Low SOV on problem-solution prompts points to a specific fix: content that names the problem directly, takes a clear position, and backs it with statistics or citations a model can actually pull out and use. Research out of Princeton on generative engine optimization found that adding machine-extractable provenance, direct quotes, hard numbers, named citations, produces the largest citation gains of any content change tested.
Low SOV on comparison prompts points somewhere else. That same research found structured comparison tables earn meaningfully more AI citations than the same information written out in prose. If a brand's competitive positioning lives only in paragraph form, that's worth fixing before anything else on the list.
Weak entity signal, meaning a brand shows up inconsistently across the four platforms, usually traces back to a thin source ecosystem. Forum presence, third-party review coverage, earned press: these build the cross-source consensus models lean on when deciding a brand is real and worth naming.
Platform-specific gaps need platform-specific fixes. If Claude rarely mentions a brand but ChatGPT does so reliably, that gap often traces to missing editorial coverage, Claude's primary signal, versus review platform presence, which matters more to ChatGPT. Treating that as one generic "AI visibility problem" wastes effort; the fix looks different depending on which platform is lagging.
Sentiment problems run deeper than content strategy can reach on its own. A brand described cautiously or negatively in AI answers is usually reflecting something real sitting in the training data: dated negative press, review site complaints, unresolved forum threads. The fix there is upstream reputation work, not another blog post, and no amount of new content will paper over it.
Treat this whole system the way SEO rankings get treated inside a mature marketing team: monthly for baseline tracking, weekly alerts for anything moving fast competitively, quarterly for the bigger strategic reviews. The brands building that rhythm into their normal calendar are the ones that catch a shift while there's still time to respond, instead of finding out a quarter later that a competitor quietly took the category.
Sources
- https://www.singlegrain.com/artificial-intelligence/measuring-share-of-voice-inside-ai-answer-engines/
- https://www.semrush.com/blog/how-to-measure-ai-share-of-voice/
- https://llmpulse.ai/blog/glossary/share-of-voice/
- https://www.shadow.inc/resources/how-to-measure-ai-share-of-voice
- https://www.optimizegeo.ai/blog/ai-share-of-voice
- https://www.netranks.ai/blog/measuring-improving-ai-share-of-voice/